Surfrider San Diego submitted comments today regarding the Draft Encinitas-Solana Beach Coastal Storm Damage Reduction Project Integrated Feasibility Study & Environmental Impact Statement/Environmental Impact Report (Draft EIS/EIR).
Thanks to everyone who responded to the action alert about this - 270 residents sent emails to Wende Protzman, Kathy Weldon, and Larry Smith of the Army Corp of Engineers as of 11am on March 5, 2013. These comments will also be considered as part of Surfrider's response to the EIS/EIR.
In case you didn't see it, also check out this 4-minute video which captures comments from local surfers and members of the surf industry regarding this proposed project.
Download the comments or read the full comments here:
Josephine R. Axt, Ph.D.
Chief, Planning Division
U.S. Army Corps of Engineers
Los Angeles District
P.O. Box 532711
ATTN: Mr. Larry Smith (CESPL-PD-RN) Los Angeles, California 90053-2325 Phone: 213.452.3246
Fax: 213.452.4204
Email: Lawrence.J.Smith@usace.army.mil
Mr Smith:
Thanks for the opportunity to contribute to the planning process of the Draft Encinitas-Solana Beach Coastal Storm Damage Reduction Project Integrated Feasibility Study & Environmental Impact Statement/Environmental Impact Report (Draft EIS/EIR). As stakeholders in this project, our staff and volunteers have dedicated hours of time meeting with the local cities and consultants as well as reviewing the over 1500 pages of the draft EIR/EIS and its 14 appendices. We thank you for the additional week you gave us to prepare our comments.
Surfrider Foundation is an organization representing 250,000 surfers and beach-goers worldwide that value the protection and enjoyment of oceans, waves and beaches. For the past decade, San Diego chapter of the Surfrider Foundation has reviewed and commented on coastal construction projects and policy in San Diego County. We take a project of this size and expense very seriously.
We feel your draft provides a fair look at the coastal processes that are affecting San Diego County. However, we feel the beach fill amounts associated with this project are too large and will negatively impact surfing conditions at surf spots within the project area. Surfing is an economic driver for San Diego County, and the project area contains iconic surf spots such as Swamis and Cardiff Reef, which are known worldwide for their unique and enjoyable waves. Surfrider is a member-driven organization that is dedicated to the preservation of surfing resources. Any impacts to surfing and surf spots are not acceptable to us, our membership, or the public at large. Given that the severe impacts to surfing identified in this study are not part of the monitoring or mitigation of this project, it is not possible for us to support any of the project alternatives. Our specific comments to the document follow.
IMPACTS TO SURFING NOT CONSIDERED IN ALTERNATIVES
Section 5.12.2 - Surfing Change Analysis
Impacts to surfing that are identified in Section 5.12.2 need to be considered in project alternatives.
The surfing analysis is a welcome change to beach nourishment project EIRs. It was well done and provides an accurate description of the core resource Surfrider is concerned with preserving. Given that, it makes it much harder to understand why the negative impacts to surfing in the project alternatives are not discussed in project design and the determination of fill amounts. According to your analysis (Appendix B Table 11.4.7), the amount of sand used in this project will impact Stone Steps, Table Tops, and Pillbox in ways detrimental to surfing with the likely transformation of these surf spots from reef break to beach break. We strongly object to the statement that follows this table, “the overall frequency of surfable waves within the study area are not expected to change significantly as a result of the Project alternatives.” We believe the quality and frequency of the surfing experience will be severely altered by degrading prized reef breaks within the study area. Table Tops will be altered in a way that would cause a traditional reef break to transform into a beach break. Table Tops has an important distinction as a surf spot in San Diego County, as it is one of a few that is rideable when the larger, longer period swells of winter hit. It is unlikely that as a beach break Table Tops will continue to break in the same manner. The many surfers that surf there during larger swells will have to travel to other breaks out of the area, thereby reducing the recreational activity at the beach. Please view this 4-minute video (http://vimeo.com/61054486) which captures the reactions and comments of local surfers and members of the surf industry.
Additionally, the reef at Table Tops provides an interesting and unique nearshore environment of sea grass, birds, mammals, fish and invertebrates for families to explore. It is hard to imagine how this will look under a carpeting of sand.
UNCERTAINTY WITH MEDIAN GRAIN SIZE OF FILL MATERIAL
We request clarification regarding the grain size of the fill material. Please provide the median grain size to be used in the beach fill.
In the Surfing change analysis, there is language that suggests some unknowns about the median grain size of the fill material (d50). For example, “However, if an increase in d50 is expected...” and “If the nourishments result in no change to d50...”. In “Impacts of coastal engineering projects on the surfability of sandy beaches” L. Benedet, T. Pierro, M. Henriquez, Shore & Beach, Vol. 75, No. 4, Fall 2007, p3, the authors note that beach fill can “... affect surfing over the long-term if the fill sediments have a mean grain size and a sediment distribution that significantly differs from the sediments that are currently on the beach.”
SURF SPOT/SURFABILITY MONITORING NEEDS TO BE A COMPONENT OF PROJECT MONITORING
Section 4.13.6 - Surfing
Include mitigation for loss of surfing resources, which should allow adaptation of the fill amounts and frequency. Surfrider monitoring program will end before this project starts, but Surfability monitoring should be implemented at least one year before first beach fill.
Given the predicted impact to surfing within the project area, it is imperative that Surf Spot/Surfability monitoring be required as part of this project. As mentioned in section 4.13.6, Surfrider Foundation San Diego Chapter has designed and implemented a surf spot monitoring program in response to SANDAG’s RBSP II, which seeks to provide understanding of the immediate and short term effects of beach fill on surf spot quality. Unfortunately, Surfrider’s Surf Monitoring Study program will end in December 2013, and will not be able to provide the type of monitoring that this project requires. However, there is precedent for US Army Corps of Engineers (US ACOE) projects to include Surfability monitoring. The recently completed San Clemente Shoreline Feasibility study includes Surfability monitoring designed by Chuck Mesa (US ACOE SPL). We feel this methodology is sufficient for monitoring impacts to surfing resources. However, monitoring must be implemented for a year or more prior to any beach fill to provide an adequate baseline of surfing conditions at surf spots within the project area.
Mitigation of any observed impacts to surfing should be included in Section 5.12.
If surf spots will be impacted by this project, a reasonable mitigation plan should consist of an adaptive strategy to adjust subsequent fill amounts and frequency. If impacts are shown through the surf spot monitoring, then fill amounts should be reduced.
FILL AMOUNTS ARE TOO LARGE
Section 3.2 - Final Array of Alternatives
Decrease the beach width and fill amounts for all alternatives. Proposed beach fill volumes exceed traditional/historical beach widths for the region. There is very little understanding how this extreme amount of sediment will behave in project area.
It is clearly understood that the major goal of this project is protection of private property. To this end, the project has been designed to maximize the protective nature of beaches by building the widest beach possible, given an acceptable cost to benefit ratio. However, the beach widths that are considered as alternatives in this project are extreme and well beyond what typically occurs at beaches in front of bluffs. Additionally, it is unclear what the justification for such a large difference in the proposed beach widths and intervals for Solana Beach (200 feet every 13 years) and Encinitas (100 feet every 5 years). Please provide clarification on this disparity.
It is well known that erosion of coastal bluffs provide sediment to the beach in front of them. In “Sea Cliffs, Beaches, and Coastal Valleys of San Diego County” (1984) by Kuhn and Shepard, they write of bluff-fronted beaches: “Prior to 1978 the beaches in this area varied in width from 40 to 60 feet, with few sandbars offshore. This changed in 1978, however, when stormy weather caused extensive erosion of the bluffs and canyons, which in turn provided sediment that widened the beach by at least 40 feet and caused sandbars to form offshore.” In the current environment of armored bluffs, seawalls have trapped the bluff sand and prevent the beaches from building. However, even after large amounts of bluff erosion, area beach widths are not as wide as the 150-200ft beach widths proposed as alternatives for this project. In particular, the 200 feet width seems extreme and will likely cause temporary impacts (steepened beach, surfing impact) to last longer.
There is no explanation for using such large beach widths. The potential negative impacts to the nearshore environment, seagrass and surfing are an unknown that is difficult to forecast using state of the art computer modeling. Appendix H Section 1 states: “...the influences of nearshore reefs on local sand movement are also poorly understood and likely complex because of reef geometry and orientation (e.g., channels between reefs may facilitate sand movement [AMEC 2005] and reef structure may retain sand [SAIC 2007]).”
We suggest, rather than depend on computer modeling, that the US ACOE follows the results from SANDAG’s RBSP II project as they are being compiled. The Imperial Beach portion of RBSP II placed close to 4 times the amount of sand as compared to RSBP I. Significant unintended consequences have followed at Imperial Beach, including extensive flooding and damage to private property, the formation of dangerous beach profiles, significant sand migration within close proximity to federally protected resources, and significant reduction of surfing resources. The US ACOE needs to work closely with SANDAG to understand how those unintended consequences impacts came about. We strongly urge that this project reduce the amounts of sand as part of a “Locally preferred alternative” to avoid such negative intended consequences of placing such large amounts of sand.
SEDIMENT MONITORING NEEDS TO TAKE PLACE MORE THAN TWICE A YEAR
Provide a sediment monitoring program that utilizes state of the art science and high frequency profiling similar to that which has been implemented by local scientists from Scripps Institution of Oceanography.
The only way to understand the impacts and behavior of the larger beach fills proposed for this project is through intensive monitoring. The Draft EIR/EIS does not outline a very substantive monitoring program. Measuring profiles in Fall and Spring only, does not provide any information on how the fill is dispersed in the weeks and months after placement. Two profiles a year will only provide some seasonal dynamics, and will not provide adequate evidence to understand the impacts of the beach fill on surrounding nearshore environment and surf spot quality as they are happening. Please strengthen your monitoring program, and involve local experts at Scripps Institution of Oceanography who have implemented this high frequency monitoring during RBSP I and II as part of the Southern California Beach Processes Study (http://cdip.ucsd.edu/SCBPS/).
It is also unclear what the minimum beach width is that would trigger the next round of sand placement. In other words, if erosion rates are higher than expected and the beach narrows, is there a point when additional fill will be placed? These uncertainties could change both costs and severity/duration of impacts. Please clarify the mechanism to identify what conditions would call for more fill to be placed.
ECONOMIC ANALYSIS DOES NOT INCLUDE SURFING
Section 3.5.2 needs to include recreational benefits and losses due to surfing quality.
In order for this project to be authorized, the cost benefit ratio needs to include contributions to recreation. The cost of this project is too expensive for the US ACOE (and US tax payers) if only the protection of private property is the motivation. The study relies on a simple correlation of “towel space” to income generated by the linear extent of the beach. In the EIR, surfing and the quality of surf breaks are not considered recreation. Nor are the family and friends that travel with a surfer to another break. These are significant economic drivers and must be considered. Please re-examine the cost benefit ratio taking these benefits into consideration, and provide clear language as to how those benefits and impacts have been accounted for.
SURF SPOT AND BEACH DEGRADATION ECONOMIC ANALYSIS UNDER THE ALTERNATIVES ARE AN OMISSION AND ERROR IN THE STUDY
Economic analysis for the impact of increased backwash from the no project alternative is not studied. This is an error and omission. Backwash from seawalls will lead to diminished beach visits and decreases the value of of surrounding property that derives part of its value from walking to the beach. In addition, all recreational visits are impacted with this alternative.
In the Planned Retreat Alternative where seawalls are incrementally removed, there will be an anticipated decrease in backwash, increase in beach width, and increase in beach visits and surfing. This predicted increase in backwash if the seawalls are left intact should be used to determine the decrease in backwash if the seawalls are removed as part of a managed retreat strategy. Additionally, preserving the surfing and beach resources in a state that more closely resembles the present conditions would preserve property values of non- beachfront property in the project area as well as increasing the beach and surfing visits to the project area.
As discussed in Appendix B Section 11.4.1, “Eventually, for the without Project condition, with sea level rise, reflection and backwash are expected to increase significantly. A good example of what to expect can be found at the nearby Sunset Cliffs, as shown in Figure 11.4-3, where there is typically no beach and waves reflect off the cliffs regularly during high tide. As stated by one of the locals on Wannasurf.com, “Getting in and out at a low tide is not hard. Higher tide, big day? Better not surf here unless you are a really strong swimmer. Getting out of the water is challenging.” Clearly, with a properly designed Managed Retreat Alternative, the natural bluff line would be allowed to retreat and this impact would be reduced or eliminated. Again, the analysis fails to include economic impacts of various alternatives as a result of surf break degradation or beach visit decreases.
MANAGED RETREAT PROPOSED DOES NOT MEET GUIDELINES OF A PROPER ALTERNATIVE
Section 3.1.4 needs to properly propose a Managed Retreat Alternative.
The total expected cost for the 50-year life of the project is nearly $177 million for a total project length of about 3.4 miles or $52 million per mile. The cost and time authorization for this project requires an exhaustive review of alternatives. Judging from the brevity and lack of explanation of a managed retreat plan, it is clear that this alternative was not taken seriously. The analysis does not provide any quantitative examination to provide a realistic comparison of costs for project vs. retreat. The breakdown of costs associated with Managed Retreat in Appendix E, is unfortunate in that the Cities have indicated they still intend to armor the cliffs when roads and infrastructure are threatened. This topic will take leadership and discussion that is absent from the EIR. Furthermore, a reason given for screening of retreat is that coastal cities don’t want to support this. This is unfair to coastal cities, as their budgets obviously don’t allow for buying out all of the bluff top houses. The "retreat scenario" that was modeled only relies on property owner action, not pro-active action by the cities or US ACOE. If the Federal taxpayers are asked to support the $177 million to authorize this project, at least a serious analysis needs to be done. Managed retreat is now being pursued as a preferred alternative for dealing with the aftermath of Super Storm Sandy, and will become more important in a period of sea level rise.
There are several errors in this analysis as appears in Section 3.1.4 and Appendix E Section 4. First, the US ACOE fails to propose any funding as part of the project alternative. As specifically quoted in the EIR/EIS, Surfrider proposed that, “The funding for property acquisition would come from a combination of Land Lease Fees for use and encroachment on Public Land with seawalls, Army Corps Shore Protection Funding and other Funding Mechanisms as outlined in the LUP Policy 4.36. Acquisition of blufftop property meets the US ACOE goals of Shoreline Protection in that the value of threatened structures will be preserved by buying blufftop property and removing structures at fair market value.” The funding from US ACOE was completely ignored in the alternative analysis. Additionally, the analysis in Section 3.1.4 falsely concludes that the fees for Land Lease are $1000. This is not a fee. This is a deposit for a yet to be determined fee. From the LUP, “The City is collecting a $1,000 per linear foot fee deposit to be applied towards a future Public Recreation/Land Lease Fee. Therefore, until such time as a final Public Recreation / Land Lease Fee is adopted by the City following Coastal Commission approval of such a payment and certification of an LUP amendment adding the fee program to the City’s LCP, the City will continue to impose an interim fee deposit in the amount of $1,000 per linear foot to be applied as a credit toward the Public Recreation/Land Lease Fee. The City shall complete its Public Recreation/Land Lease fee study within18 months of effective certification of the LUP.”
Additionally, the alternative improperly includes replacement of private stairways as a cost (Appendix E Section 4.4.4). Such replacement of stairways is inconsistent with the LUP as adopted by the Solana Beach City Council as well as with guidance on amendments from the Coastal Commission. Private beach stairways are non-conforming uses that must eventually be abated or converted to public use.
The analysis also assumes that threatened public infrastructure would automatically lead to applications for armoring by the city. The cities actually claim that if the first row of houses were lost they would attempt to armor the entire stretch in order to protect their shore-parallel roads and utilities. This scenario (Section 4.5 of Appendix E) was calculated simply as a way to show possible expenses if the Corps does not undertake any project, and does not represent the potential costs of a managed retreat project. This analysis does not appear to account for the fact that much of the coast is already armored, and instead uses a natural bluff erosion rate. Clearly along stretches that currently have seawalls or revetments the true bluff retreat rate would be much slower, even without the nourishment project. This would allow time for relocation of infrastructure as it naturally deteriorates irrespective of marine erosion thus alleviating the City’s fear of infrastructure damage and the process outlined in Section 4.3. In fact the GSL line for 75 years of erosion in the City of Solana Beach indicates that the setback line is approximately Pacific Ave. An additional source of revenue for acquisition of Blufftop Properties would be from acquisition and rental prior to removal. The economic justification of the entire project relies on this worst-case scenario whereby the entire first row of homes, their contents and the land they sit on will eventually be lost to catastrophic bluff failures if the Corps project is not built.
Further confusing to the description of Retreat is this statement in Section 4.3, “Structure loss, structure demolition & removal, and land loss valued at non bluff-top price levels are additional damage categories present in the Retreat Scenario but not present in the Armoring Scenario because the Retreat Scenario models parcel owners that do not or cannot react in time to secure the necessary seawall construction permits, financing, and construction experts prior to structure failure brought about by episodic erosion events. The Retreat Scenario also distinguishes between bluff-top and non bluff-top land value to account for land loss that occurs between the bluff edge and structure as well as land loss that occurs after the structure has failed.” If the Retreat alternative were truly analyzed assuming acquisition, this statement should not be a part of describing the option.
In the same section, the No Project Alternative with seawalls omits, and in error fails to include an analysis of the impact on adjacent properties through loss of beach and recreation including surfing. Recreation is solely analyzed based on the value of towel space. This is unacceptable, and must be rectified.
THE ENGINEERING ANALYSIS FAILS TO PROPERLY CHARACTERIZE THE IMPACTS OF SEA LEVEL RISE ON EROSION PROCESSES
Appendix C carefully analyzes the effect of sea level rise on the erosion over the past 6000 years. Appendix C Section 5 states,
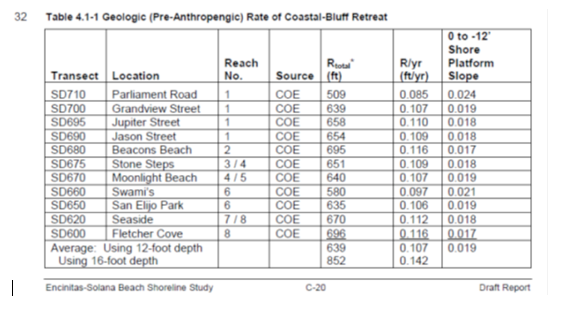
“Before anthropogenic changes in the 20th Century, the coastal bluffs retreated in accordance with long-term sea level rise since the last glacial maximum. By approximately 6,000 years ago, sea level had rapidly risen to within 12 to 16 ft of the present level. The rate then slowed by an order of magnitude to approximately 0.002 foot per year from an earlier rate of 0.028 foot per year. The configuration of the bluffs was similar to the pre-anthropogenic configuration throughout the more recent period of slow sea level rise, consisting of a transient sandy beach, sea cliffs and upper bluffs. Using this history of sea level rise, the geologic retreat rate before anthropogenic changes can be estimated by finding the distance on the shore platform between the sea level or the sea cliff and the 12- and 16-foot depth contours. Where the base of sea cliff is below sea level, an assumption is made that the same condition existed previously and the depth below sea level is used to adjust the 12-foot or 16-foot depth downward. Anthropogenic influences typically consist of flood protection and intensive urbanized and or modern agricultural development that has occurred within the last ±125 years along the coastal areas in the vicinity of the project. This type of influence has gradually reduced the available load of sediment that was naturally present in larger amounts as beach nourishment fill during pre- anthropogenic times.
For the Encinitas/Solana Beach coast, eleven profiles of nearshore bathymetry are available in Appendix B. Evaluation of these profiles using the 12-foot depth indicates the geologic rate of coastal bluff retreat is 0.11 foot per year, with about 640 ft of retreat occurring gradually in the last 6,000 years (Table 4.1-1).”

The implication is that the 6000-year sea level rise trend corresponds to an approximate erosion rate of 0.1 to 0.14 ft/yr with a sea level rise trend of 0.002 ft/yr.
In Appendix B, it is reported that over the last century, sea level rise has accelerated to between 0.003 to 0.008 ft/yr. Specifically in La Jolla, the rate is reported as 0.0068 ft/yr. This is a rate 3 times higher than the 6000-year trend. This may imply that the erosion rate would be correspondingly higher, yet all of the erosion loss appears to be attributed to loss of sand in the study and project discussion. This would predict an erosion rate of 0.3 to 0.42 ft/yr, which corresponds to observed rates in the project area. The omission of this conclusion is a gross distortion of the presumed need for the project.
From Appendix B,
“3.2.3 Sea Level Rise
Long-term changes in the elevation of sea level relative to the land can be engendered by two independent factors: (1) global changes in sea level, which might result from influences such as global warming, and (2) local changes in the elevation of the land, which might result from subsidence or uplift. The ocean level has never remained constant over geologic time, but has risen and fallen relative to the land surface. A trendline analysis of yearly Mean Sea Level (MSL) data recorded at La Jolla in San Diego County 1924 to 2006 indicates that the MSL upward trend is approximately 0.0068 feet per year, as shown in Figure 3.2-1.
According to the Intergovernmental Panel on Climate Change (IPCC), global average sea levels have risen approximately 0.3 feet to 0.8 feet over the last century and are predicted to continue to rise between 0.6 ft and 2.0 ft over the next century (IPCC, 2007). In a 2009 study performed by the Pacific Institute on behalf of the California State Coastal Conservancy (SCC) scientific data gathered from 1980 to 1999 suggests that global sea level rise has outpaced the IPCC predictions (Rahmstorf, 2007). To the contrary, an analysis of U.S. Tide Gauge records spanning from 1930 to 2010 found the rate of sea level rise for this period to be decelerating (Houston and Dean, 2011). Potential effects from an acceleration of sea level rise on coastal environments, such as erosion, net loss of shorefront, increased wetland inundation, and storm surge have the potential to displace coastal populations, threaten infrastructure, intensify coastal flooding, and ultimately lead to loss of recreation areas, public access to beaches, and private property.”

Further discussed in Appendix B above is that predicted Sea Level Rise would make the rate annually 0.006 ft/yr to 0.02 ft/yr. This would keep the same erosion rate as has occurred in the last century to a rate about 3 times higher or 1.2 ft/yr. Even at this high end estimate of 1.2ft/yr, about 60 ft of erosion would occur in the project area over the 50 year project life likely irrespective of sand input.
In conclusion, we recognize that projects like the one proposed are part of our future. We appreciate the balancing act that coastal managers must perform in order to protect coastal property while protecting coastal resources. Generally, we prefer beach fill projects to hard structures. However, the volume of sand proposed for this project will cause negative impacts to the coastal resources our membership is most concerned about. We hope you will take our comments seriously and we look forward to further discussions with you regarding this project.
Sincerely,
Tom Cook
Expert Advisor and Beach Preservation Co-Chair San Diego Chapter
Surfrider Foundation
Jim Jaffee
Expert Advisor and Beach Preservation Co-Chair (Solana Beach Resident) San Diego Chapter
Surfrider Foundation
Kristin Brinner
Beach Preservation Volunteer (Solana Beach Resident) San Diego Chapter
Surfrider Foundation
Julia Chunn-Heer
Campaign Coordinator (Encinitas Resident) San Diego Chapter
Surfrider Foundation
The Surfrider Foundation is a non-profit grassroots organization dedicated to the protection and enjoyment of our world’s oceans, waves and beaches through a powerful activist network. Founded in 1984 by a handful of visionary surfers in Malibu, California, the Surfrider Foundation now maintains over 250,000 supporters, activists and members worldwide. For an overview of the Surfrider Foundation San Diego Chapter’s current campaigns, programs and initiatives go to www.surfridersd.org or contact us at info@surfridersd.org or (858) 622-9661.