Yesterday I jumped in the water at Scripps Pier and came splashing out 20 minutes later, tail between bristled legs, because I had forgotten a wetsuit. To be so unprepared does sting a little, especially when you're within actual spitting distance of the bucket used to create the world’s longest running ocean temperature dataset. But here’s the thing — ocean temps have been all over the map this summer, so am I really to blame? I zoomed with Distinguished Research Oceanographer at the Scripps Institution of Oceanography, Dr. Art Miller, to deflect that question and dive a little deeper into sea surface temperature trends that he and his colleagues have been observing through the Shore Stations Program.
The visualization below summarizes data collected through the Shore Stations Program since this January. What should we take away from it?

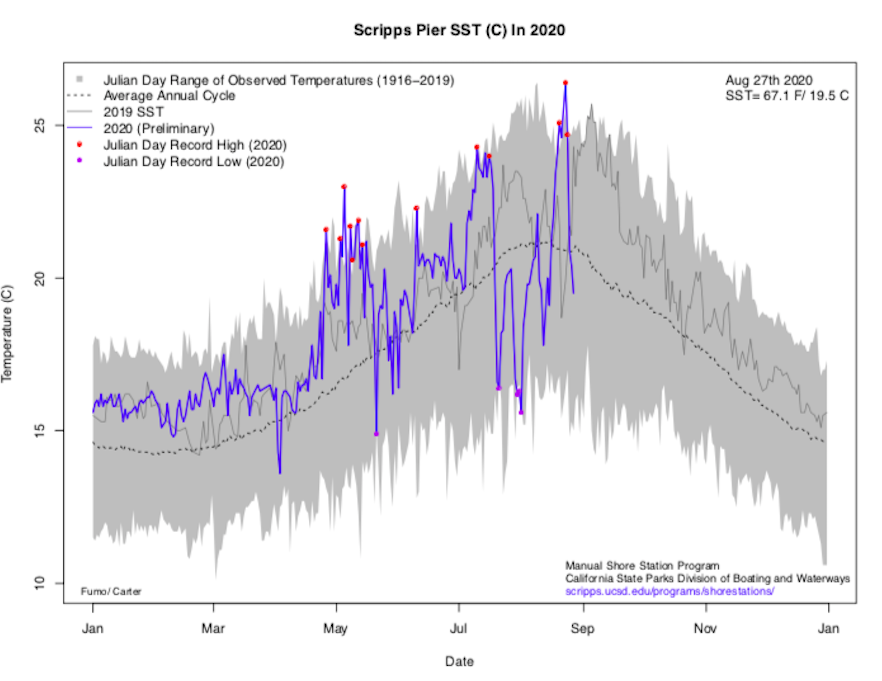
Data collected by the Scripps Shore Stations Program under Melissa Carter. Plot created by Jimmy Fumo.
This graph illustrates sea surface temperatures recorded off Scripps pier from January through August 25 of this year. The red dots show when temperatures were the highest ever recorded on that calendar day since this data started being collected in 1916. The purple dots show the lowest temperatures ever recorded on a calendar day. With eighteen record-setting days, 2020 is certainly a unique year for surface temperatures at the pier.
Can you talk us through some of the highs and lows depicted in the graph? The water seemed pretty cold in July, and notably warm in late August.
That’s right. Surface temperatures have bounced around for the past two and a half months.
We recorded the coldest sea surface temperatures ever specific to two calendar days in July. So far in August, we’ve also seen three days with the hottest sea surface temperatures on record for those days. This past week, a temperature of 79.5 degrees Fahrenheit was recorded, which matches the all-time high temperature ever recorded off the pier (Fumo et al., 2020).
It also looks like there were a couple of really warm days in the spring.
Yes — on the ocean’s surface. The five record highs for May are pretty coincidental with the ‘red tide’ — the algal bloom that persisted off San Diego’s coast from late March through mid May. The algal bloom lasted a long time, and it could have been perpetuated by the warm water, or it could have actually caused some of the warming. Algal blooms are thick concentrations of phytoplankton that can absorb sunlight and cause warming of the upper surface layer of the ocean.
What else is causing all these record temperatures and the whiplash from cold to warm in July and August?
That’s a complicated question.
The first thing to know is that ocean temperature is a very complex combination of both local and global conditions. San Diego’s coastal ocean temperature is influenced by the global currents and pressure systems that affect all of the North Pacific Ocean; it is also influenced by local wind, wave, and atmospheric conditions that may have no bearing on ocean temperatures in say, Point Conception or San Francisco Bay.
Additionally, sea surface temperature — the temperature you experience while surfing — does not represent general ocean temperature. The ocean has two distinct layers that we measure for temperature; the surface and bottom layers. Surface temperature can be drastically and quickly affected by things like air temperature, wind, wave energy, and tidal fluctuations. But surface temperature can also be affected over a period of many days or weeks because of mixing with cooler, deeper water. So mixing is one of the reasons it is tough to observe surface temperature on a specific date and correlate it with other observed timely factors, like wind or air temperature.
To illustrate just how complicated the relationship of all these factors are to each other and to sea surface temperature, think about the heatwave we have been experiencing in late August. A massive high pressure system over the western United States caused us to experience warm air temperatures in San Diego. In addition, warm, moist air from the tropics blew our way. The warm atmospheric temperatures have slowed down ocean evaporation that would otherwise be cooling the ocean and keeping its surface temperatures lower. The southerly winds also work to suppress upwelling, or the vertical transport of cold, deep water towards the surface of the ocean. High air temperatures have also pushed away a very local phenomenon — the marine layer that has otherwise been cooling off the coast. The dispersal of the marine layer lets more sunlight hit the ocean surface and warm it. All of these conditions could be factors that led to warm water you might have experienced when you paddled out last week.
Fair enough. But is it ‘normal’ to see this many daily temperature records in one year? Are the anomalies in any way linked to climate change?
Most San Diego surfers probably know that ‘upwelling’ — that process of cold deep water moving towards the surface, occurs seasonally in April in May which is why those months are associated with experienced cooler temperatures. Episodic upwelling can happen at any time of year, however. Global wind patterns are a big factor in episodic upwelling. To the degree that episodic upwelling is likely what we saw on San Diego’s coast at the end of July, there is nothing particularly strange about the low temperatures that were recorded.
There is a slightly more complicated story related to the high temperatures. Since this dataset began in 1916, there has been an observed long-term temperature increase of surface water collected off Scripps pier of about 2 degrees fahrenheit (Rasmussen et al., 2020). While we can’t link any particular warm days or weeks to climate change, average temperatures are higher, and therefore, the highest temperatures we see will be riding on a higher boundary.
Anything else you’d tell us about temperatures and the data you’re collecting?
For the data driven among you, check out the other time series posted on the Shore Stations website.